

Did it work? Using interrupted time series to evaluate health system change
Adolescent family planning visits doubled at one Kailahun health centre after a 2024 upgrade. Establishing whether the upgrade caused it is a harder question than it looks.
On a Tuesday in March 2025, Maternal and Child Health Aide Nancy Koroma opened the family planning register at Bunumbu Community Health Centre and blinked in surprise: adolescent family planning visits had doubled since the facility’s 2024 upgrade in infrastructure, medical supplies and a friendlier approach to service delivery.
Family planning services are a cornerstone of women’s health, helping individuals decide whether and when to have children. But a doubling in the register is not, on its own, evidence that the upgrade worked.
Moments like this are common across under-resourced health systems, where change tends to arrive gradually and rarely comes with the luxury of a controlled trial to test it against. Decision-makers still need something reliable to act on. Interrupted time series (ITS) analysis is one way to get there: it uses the routine monthly data a facility already collects to estimate what an intervention actually changed, without needing a randomised comparison group.
What interrupted time series actually does
ITS is a quasi-experimental design. It compares the trajectory of an outcome before and after a dated “interruption” (a facility upgrade, a training rollout, a new supply chain) and asks whether the trend shifted, accelerated, flattened, or dropped once that interruption happened. The method works in four moves: track a key metric monthly over time, mark the date the intervention started, compare the before-and-after trend, and set that trend against the counterfactual: what the numbers would likely have looked like had nothing changed at all.
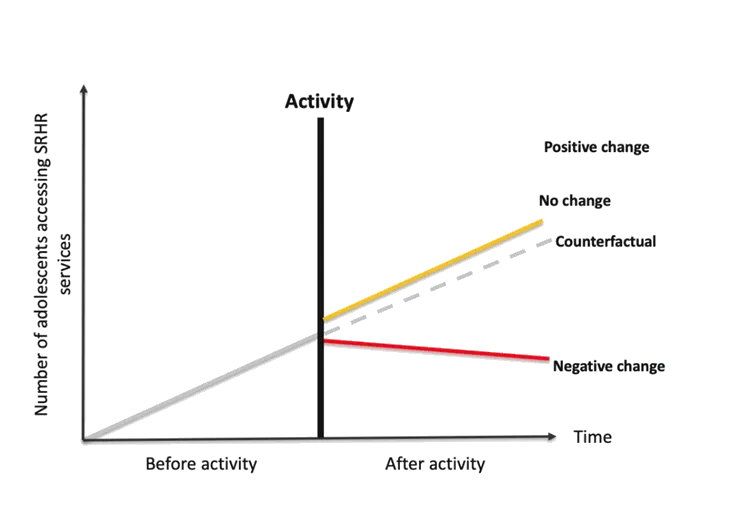
Figure: interrupted time series analysis (SickKids, Centre for Global Child Health, 2025)
This matters most in health-system contexts precisely because changes are rolled out gradually rather than all at once, and because the data required (facility registers, monthly service reports) is often already being collected, just not yet analysed this way.
“We could walk into a district review meeting and point to the counterfactual trend and say: without this initiative, we would expect twenty-five fewer family planning visits for adolescents this January. This programme has closed that gap,” says Saidu Wurie Jalloh, IfD Researcher and co-author of this analysis.
A real-world example: Foundations in Sierra Leone
ITS has been central to evaluating the Foundations project, a multi-country initiative improving adolescents’ access to sexual and reproductive health and rights (SRHR) services. In Sierra Leone, the project supports a set of facility-level interventions rolled out at different times across different sites, which raised an obvious question for the project team: how would they know whether any of it actually improved access for adolescents?
Working with the SickKids Centre for Global Child Health, IfD tracked 39 primary health units from 2019 to 2025, modelling each facility’s monthly counts of adolescent antenatal care and family planning visits against the exact month its intervention began. At Bunumbu, the data confirmed what Nancy Koroma had already noticed on the ground: a genuine rise in adolescent family planning visits following the upgrade, not just a seasonal blip.
The numbers only carried the story so far, though. Researchers also interviewed facility in-charges and SRHR providers, because the register can’t show a shift in staff confidence, a change in workload, or why an intervention that changed the trend at one site did nothing at another. Combining the routine data with that lived experience is what turns a chart into an explanation.
If you’re considering ITS for your own work
Three things matter most before starting: having (or knowing how to get) regular time-based data (monthly or quarterly, ideally spanning several years) from a source like facility registers; knowing the exact date each intervention began, since level and trend shifts are only meaningful relative to that point; and pairing the quantitative model with interviews or other qualitative methods that can explain why a trend moved, or stayed flat.
Interrupted time series won’t substitute for a randomised trial, and it isn’t meant to. What it offers instead is a way to extract a real answer from the data a fragile health system is already generating, provided the analysis is planned for before the intervention starts, not reconstructed after the fact. Used well, it answers the three questions that matter most in this kind of evaluation: did it work, how did it work, and where should the programme go next.